


In last week’s post, we talked about the changes we’ve been making to Stemma to improve data debugging and discoverability within the catalog. In this post, we’ll be diving into the updates we’ve made to the details pages, glossary and API - thanks to the fast feedback loops we’ve established within our product and across our customers’ environments.
Establishing best practices within data teams
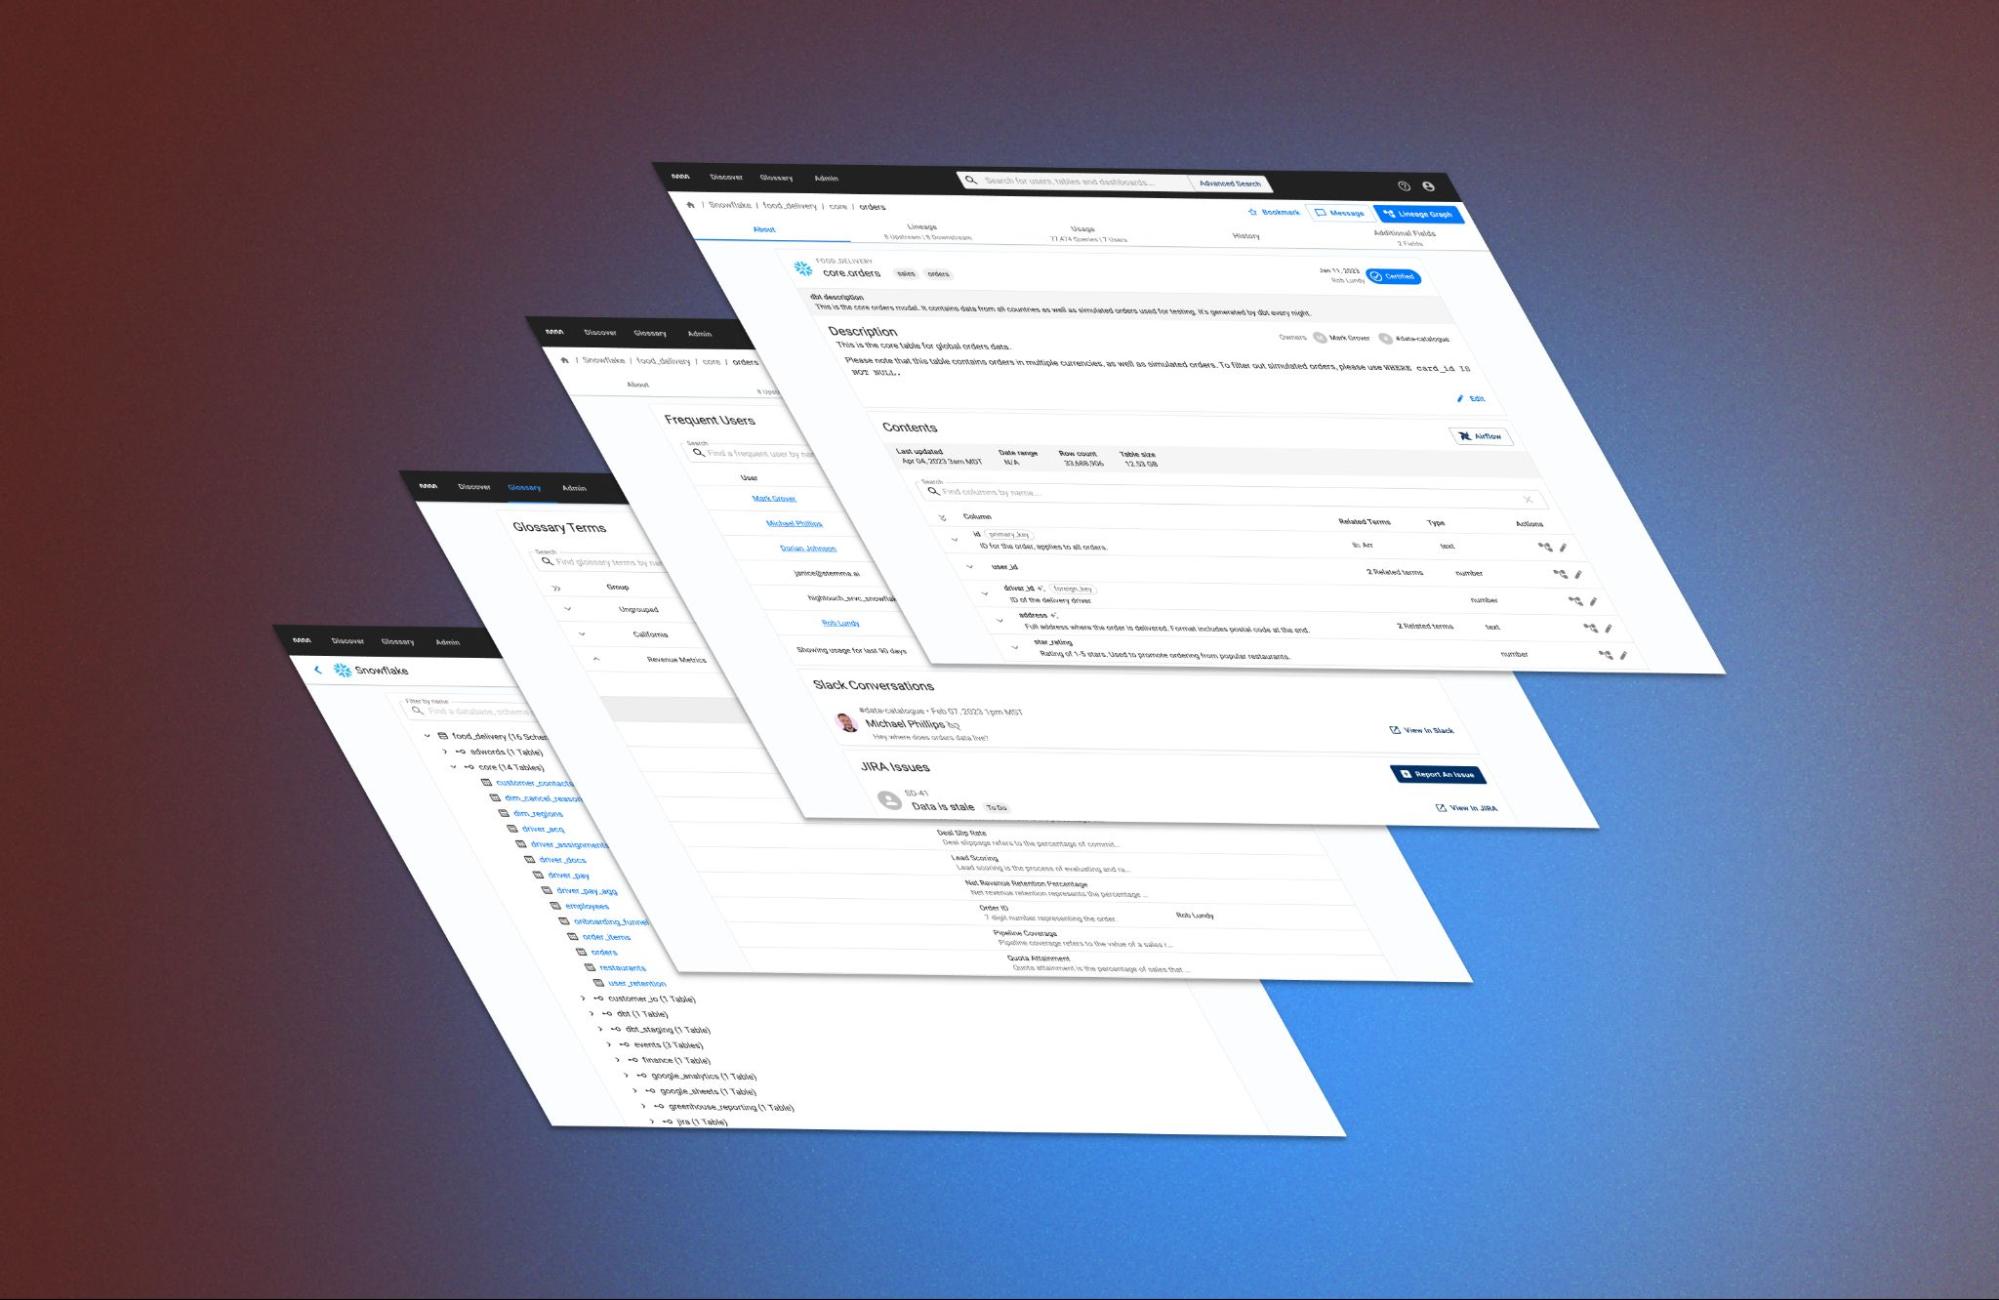
No matter how you get there, the asset page is where users really make the most out of their metadata. The new table and dashboard details pages organize the huge collection of data that Stemma collects about an asset into manageable groups:
Instead of trying to optimize the interface for a particular user or provide an unwieldy selection of configuration controls, we found a balance between the two by organizing the information by the questions users most often ask about their data:
Often B2B software is stuck between two worlds. The product either dictates boxes that all members of a given persona should fit into or it introduces complex customization and configuration tools to account for differences between personas. Instead of falling into either of these traps, we tracked how usage patterns emerged in our research and optimized for those use-cases.
We found that the use-cases for the table details page can best be described by the type of question someone is asking about their data:
- About - what is this asset?
- Lineage - where does this data come from, and what other data is it feeding?
- Usage - who is using this data and how are they using it?
- Additional Fields - what custom metadata has my company attributed to this asset?
This context-specific method of organizing data prevents business users and data analysts from being overwhelmed by information while still allowing “warehouse-savvy” folks like data engineers to dive into the details within each tab.
The new interface also saves engineers time while documenting columns or planning changes to data models:
- The new Autodescribe feature fills in undocumented columns by looking for documentation in columns upstream - saving hours of copy and pasting across edit dialogs or dbt manifests
- The Usage table highlights table query patterns and the source of those queries. This information is particularly useful when trying to figure out if demand is better served by a new model or to track migration completeness off of deprecated tables
Columns within each asset can be connected to Glossary Terms - standardized language with descriptions and groups. These terms help data teams connect their assets with the language of the business:
Since releasing the glossary, we got feedback on how these terms were used in real world conversations. We responded to this feedback by adding rich text descriptions, a snappy search, and bulk deletion for when a term is no longer used.
Since joining Stemma, I’ve been impressed by our ability to ship quickly in response to customer needs. At previous companies, I would have to go through lengthy review processes, multiple prototypes and dozens of user tests just to find out that a design doesn’t work quite like we expected it would in production. With a tightly-integrated design and development process, it’s much easier to see if something works in the real world, with real metadata.
At Stemma, we roll out features behind feature flags - enabling them for company by company - with an eye on our shared Slack channels for fast feedback. Small squads of team members are aligned around each feature to ensure that it gets the care and attention it deserves from initial design to fast feedback post-launch. This systematic approach helps us move fast without breaking things. We learn what works by observing the way users actually try to solve their real-world problems within Stemma.
But our user-centered approach to designing interfaces isn’t just reserved for the UI. This same methodology can also be found in Stemma’s public API:
- The Augment endpoint can add, edit or delete metadata - no matter its source. Data teams can ensure that all their assets are documented, even if they’re doing some totally custom setup
- The Lineage endpoint can modify any part of the lineage within Stemma. So if your team happens to know about a particular connection that no automated tool could easily parse, you can make sure it shows up
API Keys can now easily be made from the Admin interface where engineers already find their connections and reports:
Making intuitive documentation easy
Throughout this experience of shipping a higher quality interface to all of Stemma’s users, we’ve learned that there’s no use documenting your data if nobody wants to read the docs!
These changes address that problem head-on by providing an interface that solves the problems of data analysts, engineers and business users alike. In our new interface, both manually documented and automatically generated metadata is communicated clearly and efficiently so that anyone can benefit from its use.
Keep an eye on this blog for more from me and, if you’re already a customer, keep an eye on your inbox for a request for feedback! As you can tell from this post, we couldn’t build Stemma without it.